Five Steps to Using Facebook Insights
By Matthew O’Mara
September 3, 2013
![]() A handy, free tool for getting beyond vanity metrics
A handy, free tool for getting beyond vanity metrics
Step 1—Activate Facebook Insights
Below your page’s cover photo select the “Gear” button and click on “Insights.”
Step 2—Look at the big picture
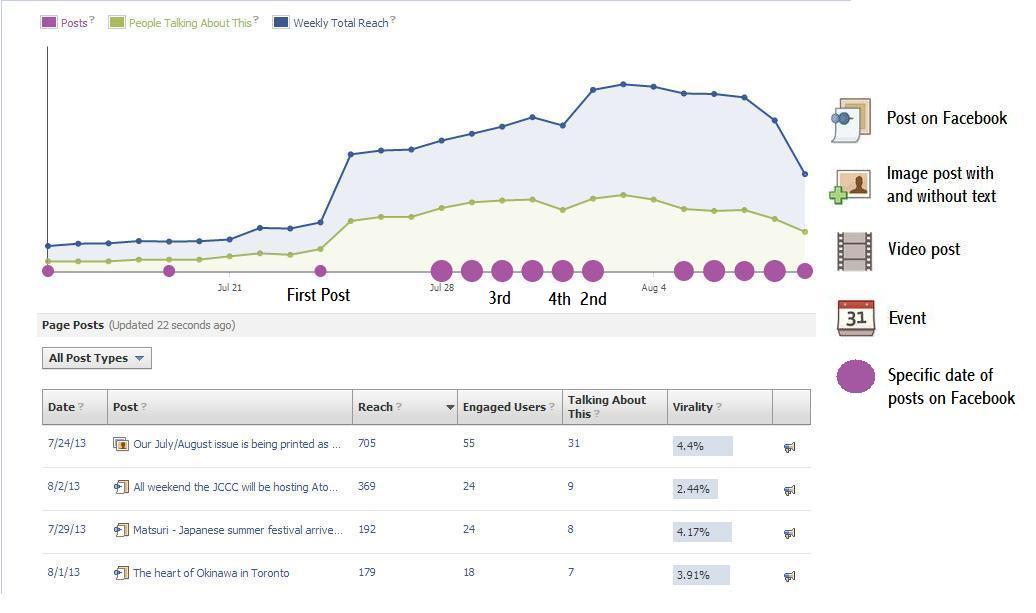
What you see here is the overview of “Likes,” “Reach,” “Talking About This,” and “Check-Ins.” Each of these sets of data represents the number of people who have interacted with your page. In the graph below, the number of people who “Like” the Facebook Page has increased by 3.45% (not broken out here specifically) while the number of people talking about the page has decreased by 12.07%. You want to know why, so keep drilling down.
Notice how reach, engagement, and virality all affect each other. Virality is the number of people who have created new content from your post as a percentage of the number of people who have seen it.
The first three articles in the image below all were posted on the same day (July 24), yet each has a different level of engagement not visible. The photo gallery—with its ability to be shared on multiple social media sites—offers the greatest level of engagement—with nine users—while the lowest level of virality due to the extra step in sharing. Not every person is willing to take that second step.
The second item is an article that was time sensitive with an accompanying event going on at the same time. This timeliness increased its virality; in other words, good timing equals increased shareability.
Each of these types of post has a reach that varies on its conditions. Photographs are more easily shared on other social media platforms like Instagram, and timely articles are more likely to be shared with users looking for specific content.
Step 3—Review Posts
The list below the graph shows the numeric responses to each of the posts. “Reach” describes the total number of people who saw your post, “engaged users,” also known as conversions, are people who “shared” your post, “virality” is the number of shared shares.
Step 4—Understand the numbers
When you access your posts on Facebook Insights you can click on each number to see a breakdown of its reach, engagement, and how people are talking about the post.
For example, the top post in the image below was a photograph with text below it. It had a reach of 705 people with 53 people organically finding the post and 658 people finding it virally. “Organic” means people have seen your post in their own feed; “viral” means that have received it through interaction with a friend. These numbers will tell you what posts are more likely to be shared with your followers. The more viral views, the better.
Since the image post did much better than the three text posts below it, you want to use images in future.
Facebook Insights can provide a breakdown of the “reach” of each post, indicating which how many are seeing your content from friends and how many on their own feed. If the numbers are low specifically for text posts then you need to look into what other kinds of posts did better on the site and emulate their success.
Look into the response to the type of media used in your post—text, video, or photograph. For example, an image with text—the first one on the list—had the highest reach of the posts with 705 people reached, 54 engaged, and 31 people talking about it. The post also had a virality of 4.4% meaning that of the people who have seen the post (705) 4.4%, or 31 people, have made his or her own content to share with friends. The image also shows that a video did the worst with a reach of 77, engagement of 9, and a virality of 1.3%. This shows that while video content may garner some attention, images, photographs, and infographics are far more easily shared with your audience.
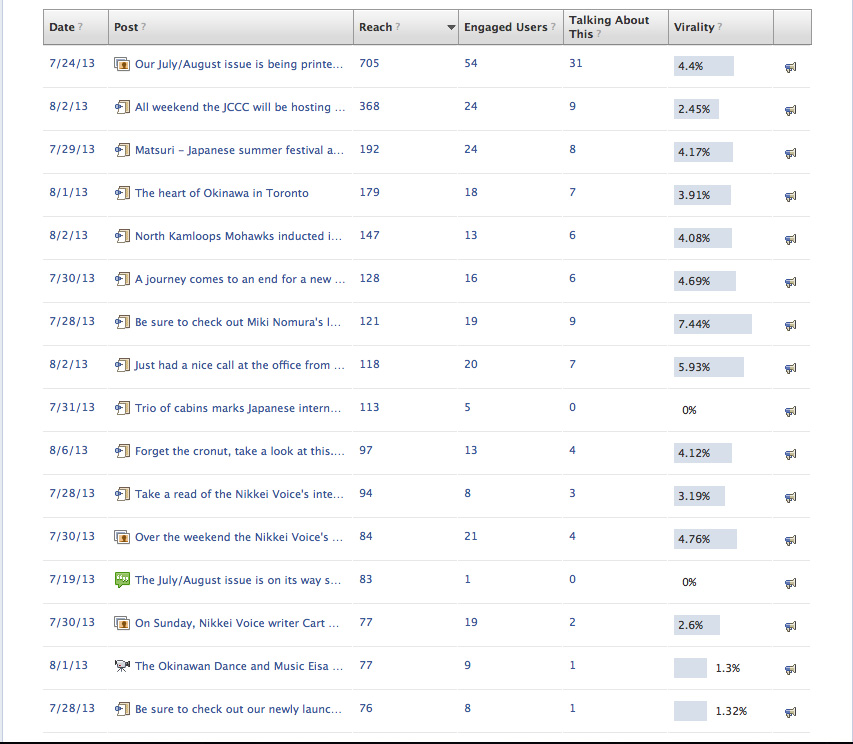
The image here—the continuation of the list that starts above—is a pos-tby-post breakdown of reach and engagement. Using this view can give users insight into what posts have the most positive effects on your audience. Look into each section carefully and write down the trends you see.
Step 5—Use the results
Tracking your social media’s metrics helps you understand what’s trending with your audience and how to better serve its needs. Using these results, the Facebook page featured in the images above might focus efforts on creating easily shared images and unique content to drive more engagement on the page.
The social media coordinator might also look into ways of increasing the number of people talking about each article by timing the release of each piece of media with an event. For example, the second post in the image above was an event listing posted two days before its start. This provided interested users with the ability to share the post with others, increasing engagement rate and increasing the likelihood of visitors lingering on the page to see things like advertisements, promotions, and content.

Matthew O’Mara is managing editor of Nikkei Voice, a Japanese-Canadian publication in Toronto.
Copyright © 2025, Musical America